 We do NOT use Cookies.

Learn More
See Actual DDAmanda Trading Charts: Trading Charts
DDAmanda is a powerful scanning and research application developed by traders and analysts since 1999. This scanning platform allows the user to rapidly discover, research and analyze stocks faster than any other software or website available. DDAmanda will save you many hours in finding and researching stocks.
We also have a Private Telegram Chat with many experienced traders where
you will get tips and support. We all help each other make money.
The use of DDAmanda is broken up into three generalized categories.
They will be explored through a brief explanation of the DDS process.
Quick Start Guide: Quick Start
Click here to read FAQ's
Click here to go back to the Home Page.
Click here to Sign Up.
Scanner
Having selected a scan configuration from one of the 29 default settings,
DDAmanda quickly scans the entire OTC and NASDAQ database for tickers
that match the scanning criteria. Any tickers matching the search parameters
are displayed in alphabetical order, each accessed one at a time by
the Previous or Next buttons. Essentially DDAmanda scans
for matching stocks and stops when one is found. At that time a complete
picture of the stock is shown, and the DD buttons come into play. Pushing
the Next button starts a scan for the next stock.
DDAmanda is loaded with 25 pre-configured scans that allow users to
scan for a variety of conditions. In addition to these highly effective
parameters, every aspect of each scan is completely customizable. There are also several slots open where users can create their own scans from scratch.
Also, you have the ability to enter public or private notes on the stocks you come across. These will help jog your memory at a later time. You can also use the central Quick Notes area to make notes that only you can see.
Public notes from other members will give you a heads up on many of
the stocks in the database. (All OTC and Nasdaq stocks are in the database).

Stock Research
Once a security has been identified, DDAmanda allows the user to rapidly
research and digest available information from a wide variety of sources.
Each button opens a new window with the selected ticker already pre-loaded
from DDAmanda, i.e if you are looking at stock symbol ABCD, hitting
one of the Chart buttons will open the chart for ABCD at StockCharts.com
and pushing the Filings button will open the filings for ABCD
at OTCMarkets.com.
From Charts, SEC filings and social media, DDAmanda helps you quickly
decide what security is worth your valuable time and money.

Technical Data & Proprietary Indicators
In addition to Scanning and Research applications, DDAmanda also has
several proprietary indicators that give members a significant edge
in the market. Factor is an important indicator found nowhere
else that indicates the movement of attention in a security. Drag
provides information on how much effort/money it takes for the stock price to move, and can be used to determine short term price movements.
In addition, DDAmanda provides advanced technical information in a rapidly
accessible format. MACD, Volume, RSI and price movement histories are
just some that are available in a single location.


Screenshots of Actual Trading Scenarios

A $500 buy of USEI at .0013 (Range was .0010-.0015 the day after the tipoff) would have grown to $15,365 at .04. High was .048.

AERS is still going strong as of 7-20. A $500 buy at .0026 would have
given a $5000 profit at .0286. High was .0299 on 6-22.

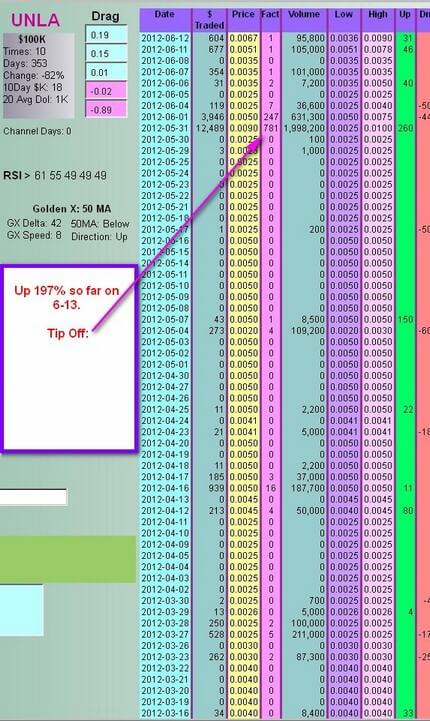
UNLA ran to a high of .023. $500 at .0025 would have grown to $4200.
LFZA. Classic Insider of all time:
Ok. Here is the all time classic insider tipoff play: LFZA from back in 2006. See all the insider buying before the Reverse Merger was announced on 10-11? The DDAmanda insider scan would have picked this up.
Notice the factor of 3801 the first day (a factor of 10+ is significant). Followed by a 424 and 5833 factor that verified the run was coming.
A $500 buy at .0008 (it actually started at .0004) and a sell at .80 (actual high was .84) would have resulted in a profit of $444,000!!.

